Map Layers

Every layer in the app, what it shows you, and where it covers.

Get it on the App Store
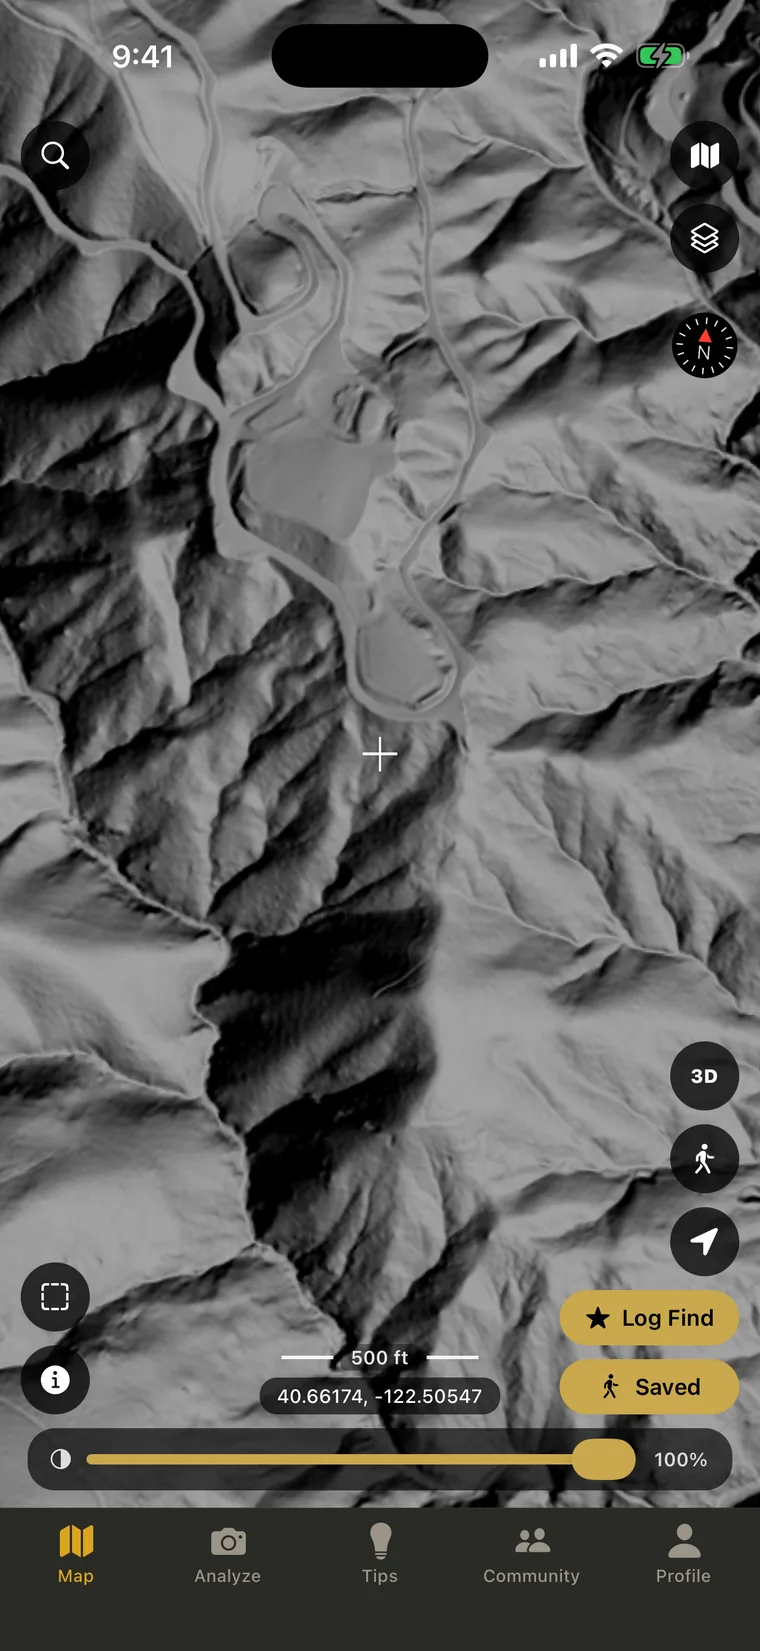
Bare earth lidar hillshade over steep terrain, with the canopy stripped away and drainages and benches visible as shapes in the ground

1-metre bare earth

Pro

See the ground with the trees taken off

Bare earth lidar removes the canopy and leaves the shape of the dirt behind. Old placer cuts, hydraulic pits, tailings piles, ditch lines and benches read as forms you can recognise, on hillsides no aerial photo can see into. Two layers ship: a single-light hillshade and a multidirectional build of the same elevation data.

  • Four light angles. Multidirectional lights the terrain from four azimuths, so a ditch running parallel to one light source does not disappear into shadow on a north-facing slope.
  • One metre resolution. Detail holds all the way in to z17, close enough to pick out a single cut rather than a general slope.

Coverage California, Oregon and Nevada load instantly. Other areas may take a few seconds the first time you view them, then load instantly after that.
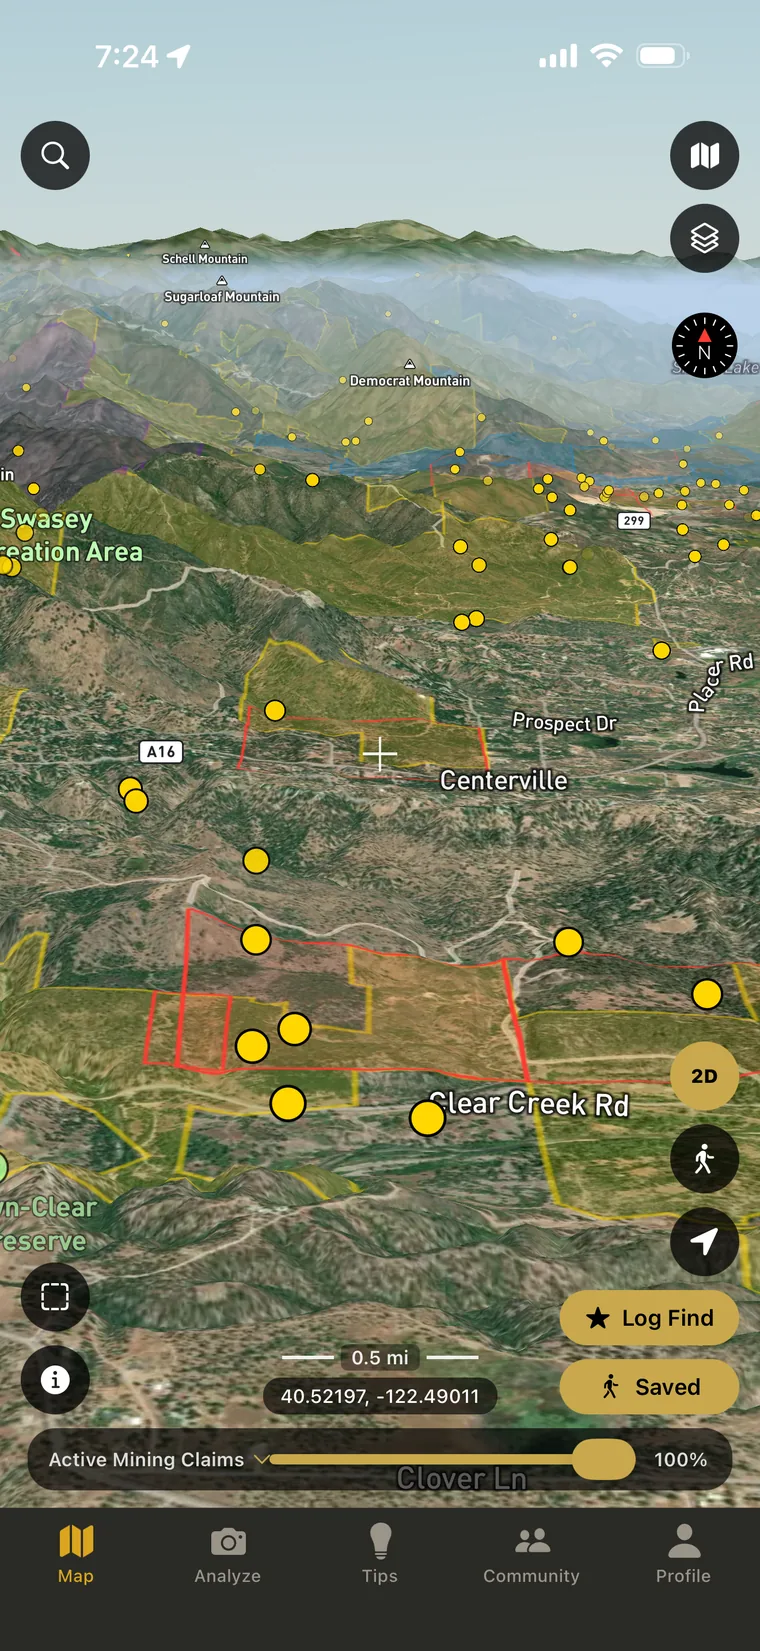
The map tilted into 3D above Clear Creek near Redding, California, with active mining claim boundaries drawn over the terrain in red and yellow

Updated daily

Pro

BLM active and closed claims

Over 500,000 active claims across the United States and more than 80,000 closed claims, refreshed daily.

Active claims tell you whether the ground is already spoken for before you dig. Closed claims tell you where somebody once thought it was worth filing on, which is a lead in itself.

Coverage The entire United States.

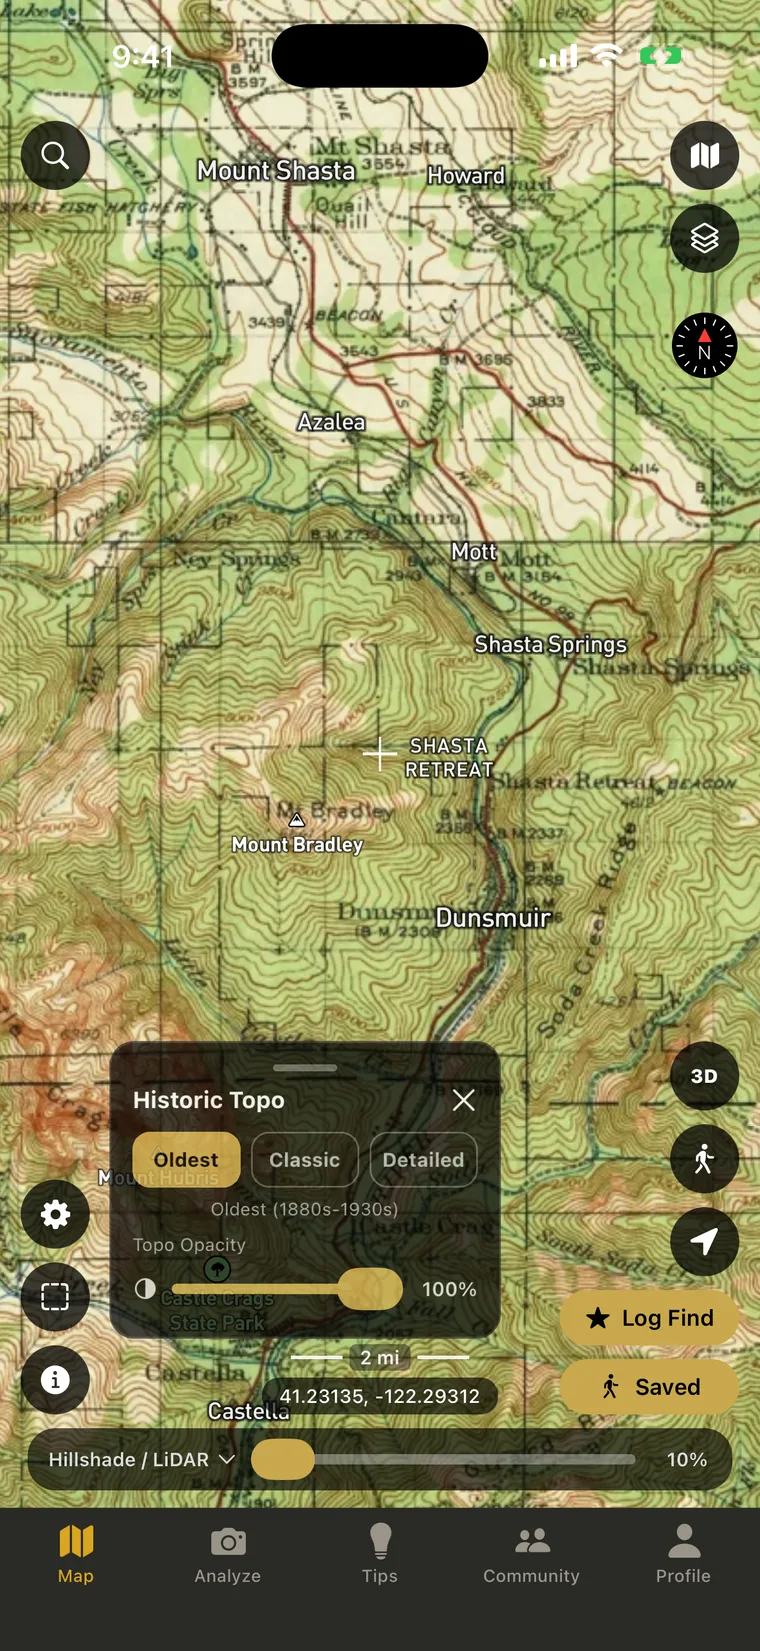
A scanned historic USGS topographic sheet drawn over the map, with the era band picker open showing the oldest, classic and detailed options

Sheets back to 1879

Pro

Read the maps drawn while the ground was still working

Scanned USGS sheets going back to 1879 carry mines, ditches, camps, mills and roads that appear on no modern map. What was worth drawing then is usually still in the dirt now, just grown over. Three era bands toggle independently, so you can step through time on a single spot.

  • Three era bands. Grouped by map scale at 24k, 62k and 125k, each switched on and off on its own.
  • Compare across decades. One band at a time shows what stood on a spot in the 1890s against what stood there in the 1940s.
  • Opacity you control. Fade a historic sheet over satellite imagery to line an old ditch up against present-day terrain.

Coverage California, Nevada, Oregon, Washington and Arizona.

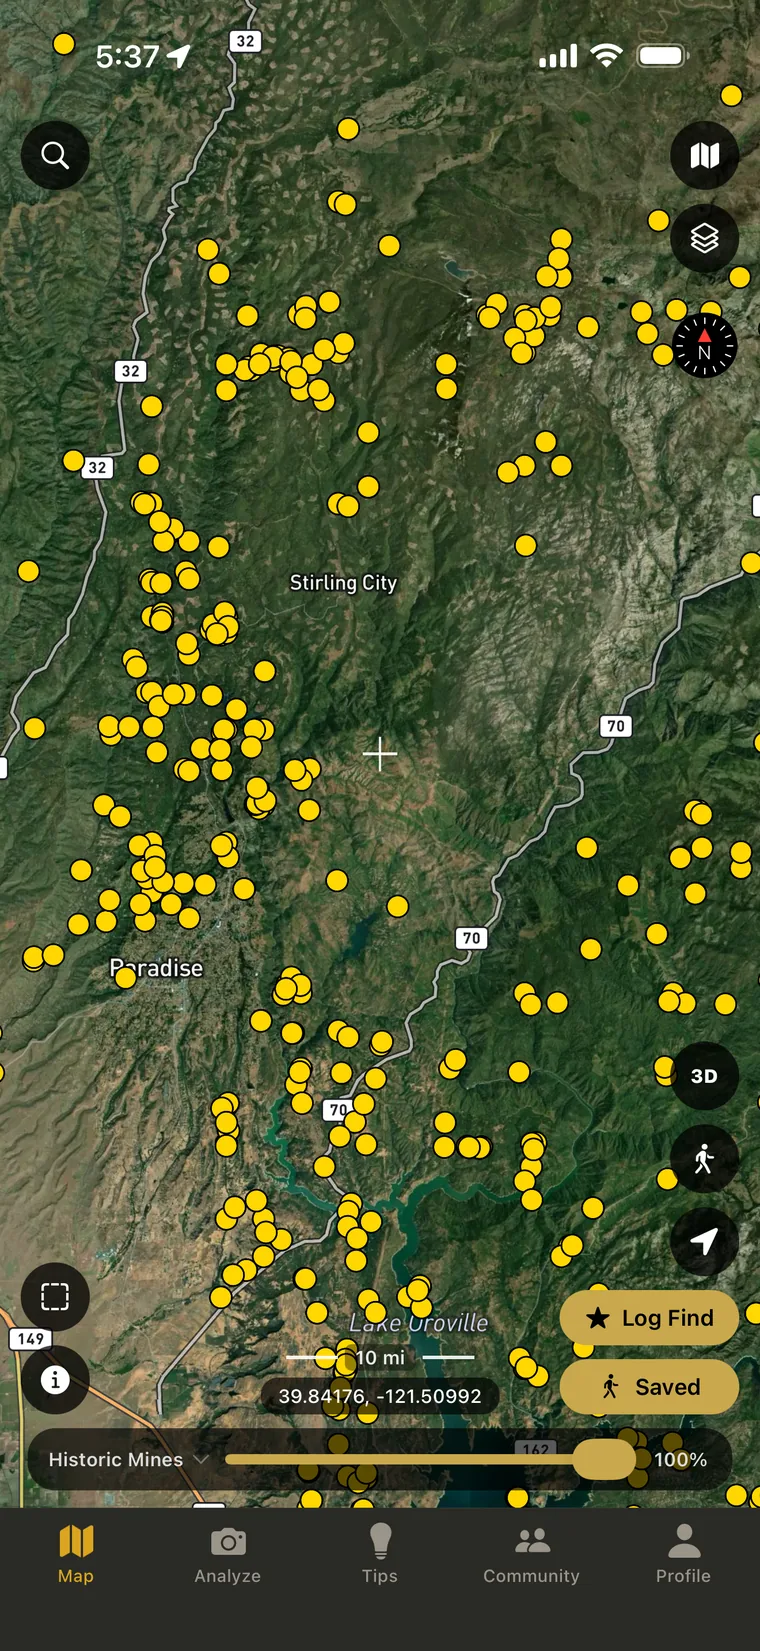
Satellite map around Stirling City and Paradise, California, with hundreds of historic mine sites drawn as points clustered along the drainages above Lake Oroville

83,968 documented sites

Pro

Every mine somebody bothered to write down

83,968 documented historic mine locations, drawn on the map as points. Each one carries a name, the commodity, the deposit type and the development status. Those last two fields are what make the layer worth reading rather than just worth having.

  • Producer or prospect hole. Development status separates a documented producer from a hole somebody scratched at once and walked away from.
  • Placer or lode. Deposit type tells you how a site was worked before you spend a morning driving to it.

Coverage The United States.

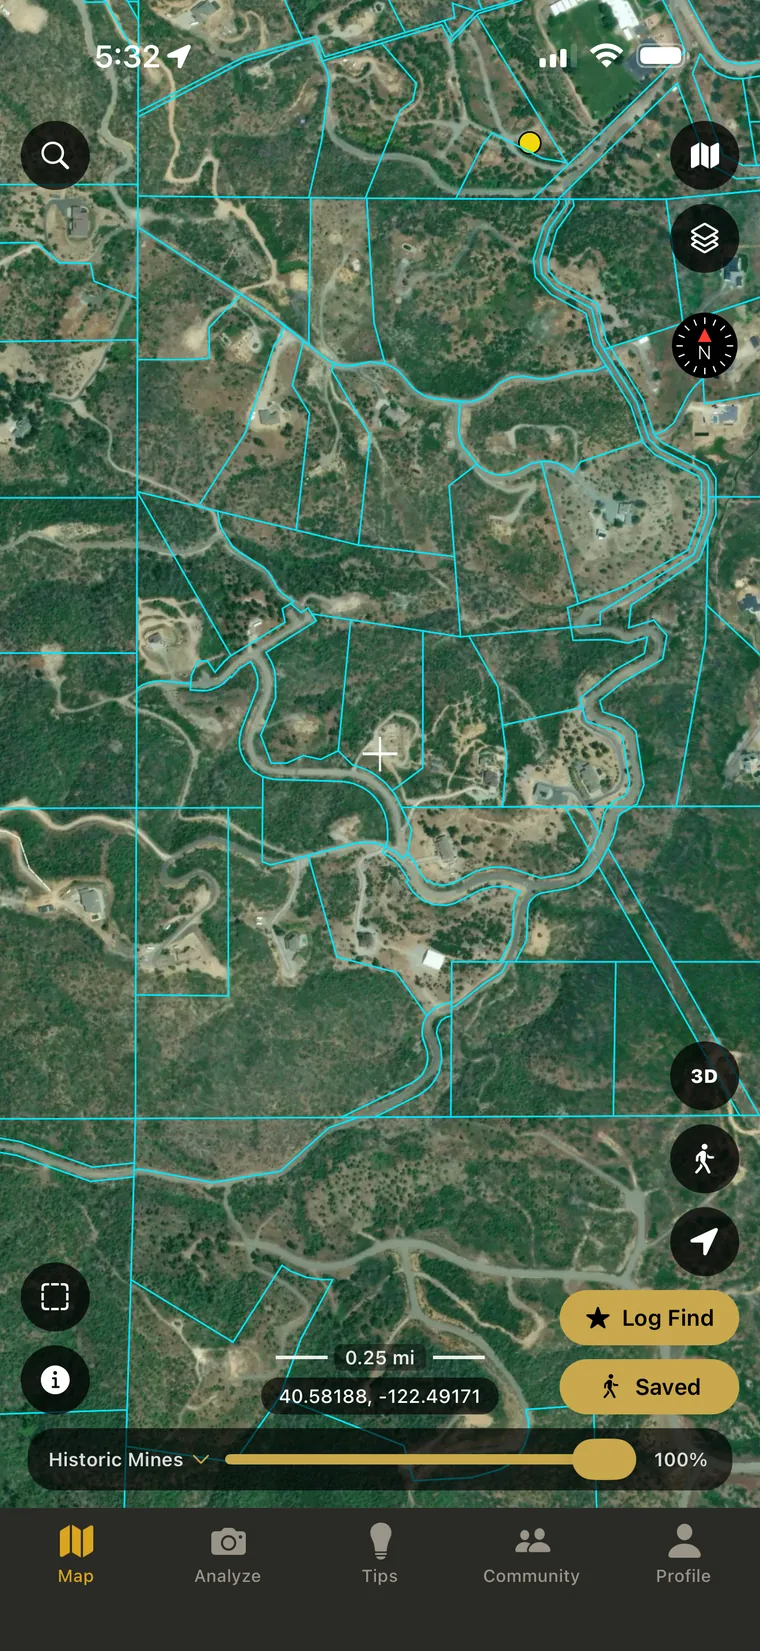
Parcel boundaries drawn over satellite imagery on rural ground west of Redding, California, with individual lots and their access roads clearly separated

133 counties

Pro

Know where public ground ends

Parcel boundaries sit over the map so the line between public and private is one you can actually see. Tap a parcel and it opens what the county publishes about it. The difference between asking permission and trespassing is usually one boundary nobody fenced.

  • Tap for the details. A parcel returns its assessor parcel number, the address and the acreage.
  • Owner names vary by county. Some counties have owner information and some do not.

Coverage 133 counties across California, Oregon, Washington and Arizona, with more to come.

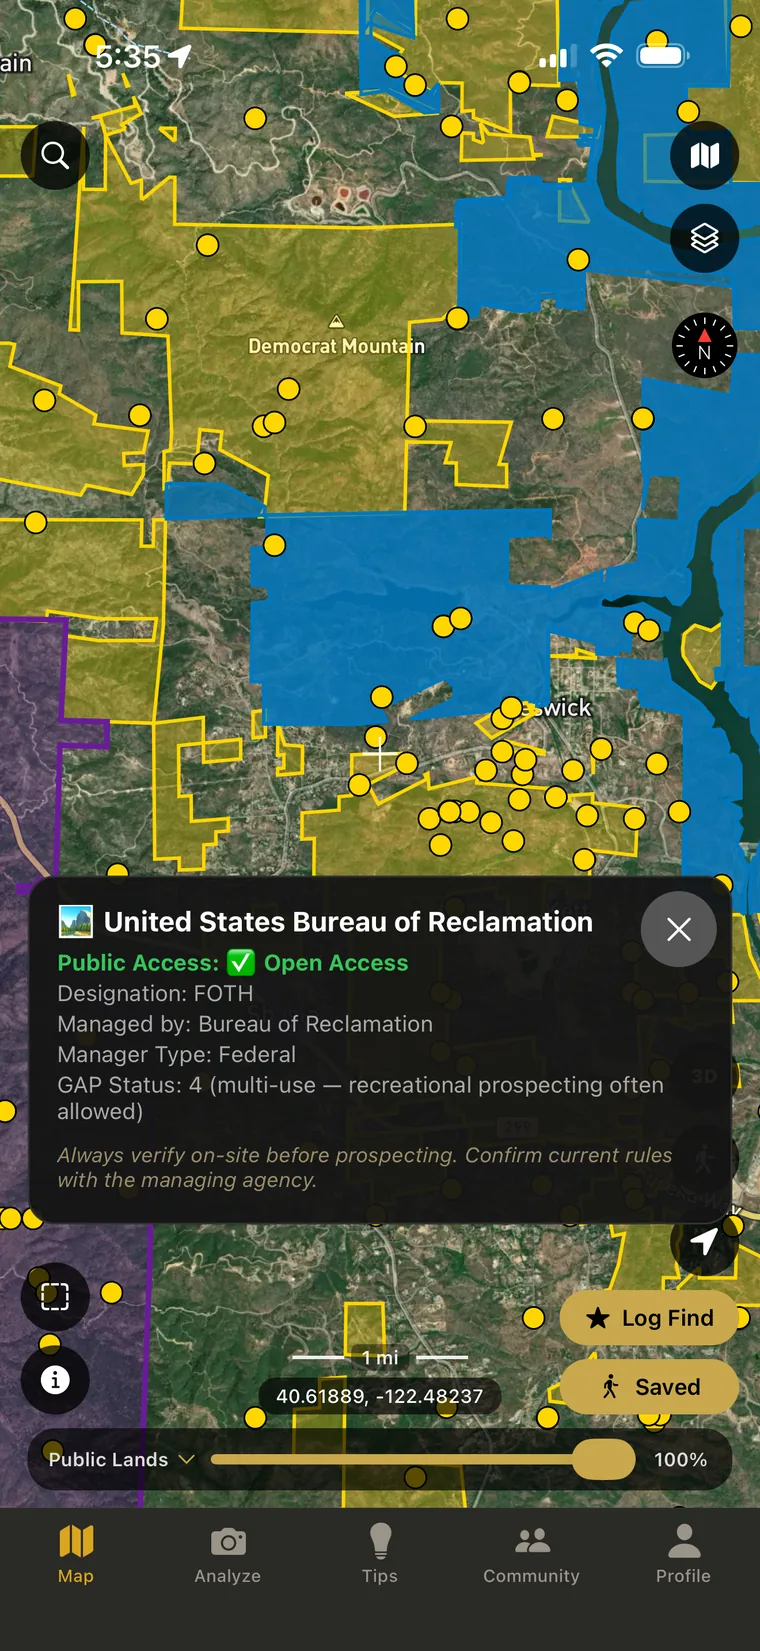
Public land unit boundaries near Keswick, California, colour coded by managing agency, with a unit detail open showing that the area is open to public access and managed by the Bureau of Reclamation

Per-unit boundaries

Pro

Public does not always mean open

Land status is drawn unit by unit rather than as one undifferentiated block of federal ground. Three separate toggles cover who holds the ground and what has been laid on top of it. Who owns a piece of land will not on its own tell you whether you are allowed to prospect it.

  • Who holds the ground. Federal, state and local land is drawn as boundaries, each one named and coloured by the agency that manages it.
  • What sits on top of it. Wilderness areas, monuments and similar restricted designations toggle on their own and can close ground that looks open underneath.
  • Whether you can walk in. Each unit says whether it is open to public access, which is the part that decides your weekend.

Coverage The United States.

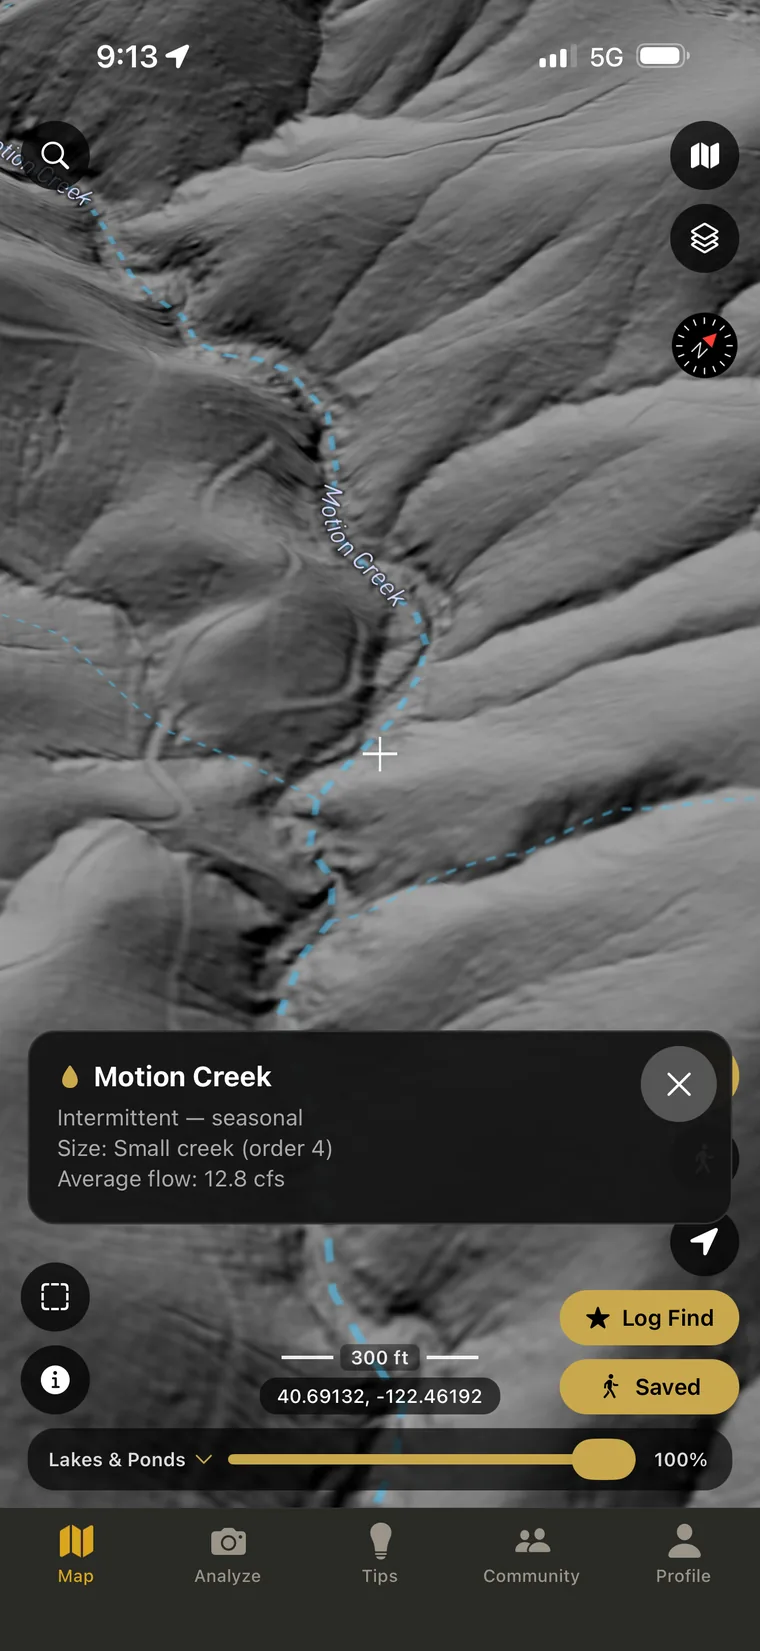
A creek traced across bare earth lidar with its detail sheet open, naming the creek, its flow regime, its size class and its average annual flow in cubic feet per second

Tap any waterway

Pro

Sort the live drainages from the dead ones

Every mapped waterway, drawn from the USGS National Hydrography Dataset. That includes the small feeders and seasonal channels that never make it onto a road map, which are usually the ones worth walking.

Tap a waterway and it identifies itself

You get its name, whether it runs year round, only in season or only after rain, its size class, and its average annual flow in cubic feet per second.

  • Most washes are dry when you stand in them. Knowing whether a channel is a perennial creek that dropped, a seasonal drainage or pure storm runoff tells you what kind of deposit to expect and where the material came to rest.
  • Work it out before you drive. For dry washing, and for detecting dry creek beds, live and dead drainages sort at the kitchen table instead of costing a day in the field.

Coverage The United States.

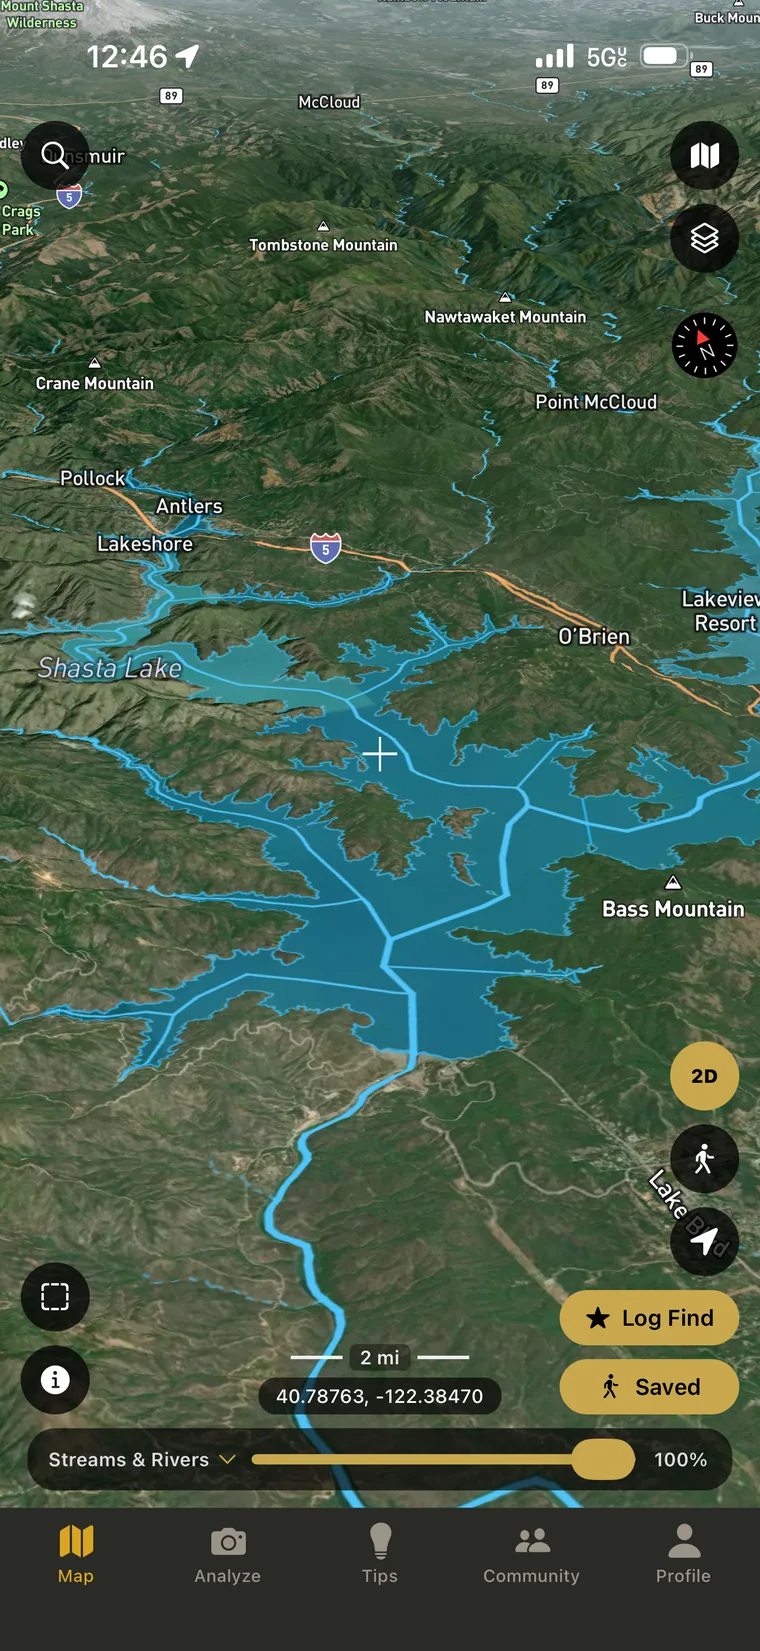
Shasta Lake seen in tilted 3D over satellite imagery, with stream and river channels drawn through the reservoir pool and up each of its arms

Channels drawn through the pool

Pro

Know where the old bed lies when the water drops

Lakes, ponds and reservoirs drawn from the USGS National Hydrography Dataset. Tap one for its name, its surface acreage and what kind of water body it is.

  • The river is still under there. Where a channel runs through a reservoir the channel is drawn in, so when the pool drops in late summer you know where the original bed sits rather than guessing at a shoreline.

Coverage The United States.

The rest of the stack

Six more layers that answer the second question rather than the first.

Terrain and access

  • Modern USGS Topo

    The current topographic basemap, and the reference the scanned historic sheets get compared against.

  • Geology

    Surface geology units, where a contact, a fault or the right intrusive decides whether ground is worth the walk.

  • Roads and Trails

    Roads, tracks and trails, for working out whether a promising bench can actually be reached in a day.

Mineral data

  • USMIN Mine Features

    Adits, shafts, prospect pits, dumps and tailings digitized off topographic sheets, drawn because they were visibly there.

  • Geochemistry

    Soil and sediment sample results including gold, silver and copper values, queried live so it needs a connection.

  • Magnetic Anomaly

    Aeromagnetic survey data, reading the buried contacts, intrusives and fault zones the surface does not show.

Modelled, not measured

Predictive layers

These three are models built from the data layers above, not measurements taken on the ground. Treat them as starting points for deciding where to spend a day.

  • Gold Probability

    A heat surface weighting documented mines, claim density and geochemistry together, for narrowing a large area down to a few drainages.

  • Water Flow Zones

    Terrain modelled for how water moves across it, pointing at the inside bends and gradient breaks that trap heavy material.

  • Pay Streak Zones

    Terrain modelled for where a pay streak would be expected to lie, predicted from the shape of the ground rather than observed in it.

Free My Pins and Find Log Pins are free forever. All data layers are Pro.

Every layer above is credited agency by agency and county by county on the data sources page.